
Dashboard Widget
Visual guide for the Socket.IO statistics widget in your Strapi admin panel.
Overview
The Socket.IO plugin adds a beautiful, real-time statistics widget to your Strapi admin home page.
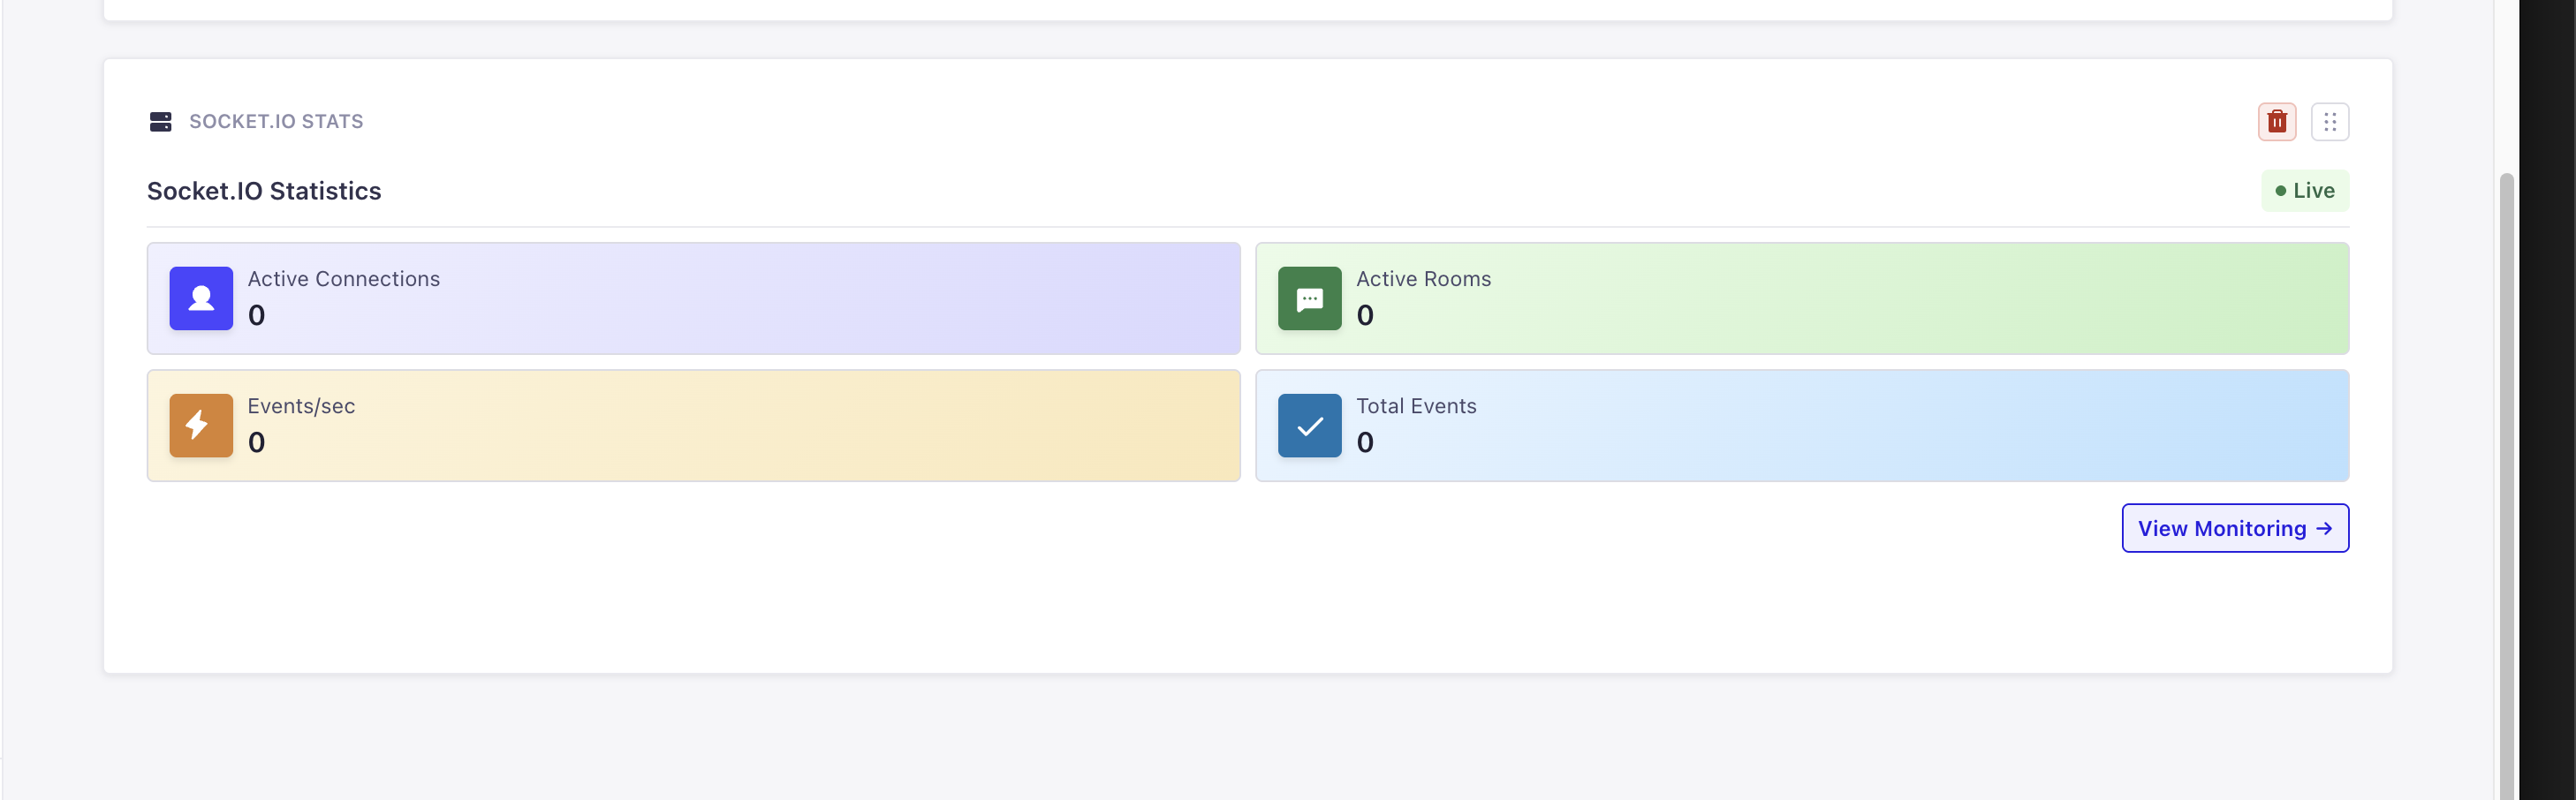
The widget automatically appears on your admin dashboard after installing the plugin.
Features
🟢 Live Status Indicator
A pulsing green dot shows the plugin is active and receiving real-time data. If the indicator turns red, the Socket.IO server is offline or not responding.
👥 Active Connections
Displays the current number of connected Socket.IO clients in real-time.
💬 Active Rooms
Shows how many Socket.IO rooms are currently active.
⚡ Events per Second
Real-time counter showing the current rate of event emissions.
📈 Total Events
Cumulative count of all events processed since the plugin started or was reset.
Auto-Refresh
The widget automatically updates every 5 seconds to provide live statistics without requiring a page refresh.
Location
Navigate to: Admin Panel → Home (Dashboard)
The widget appears in the main dashboard area below the welcome message.
Visual Design
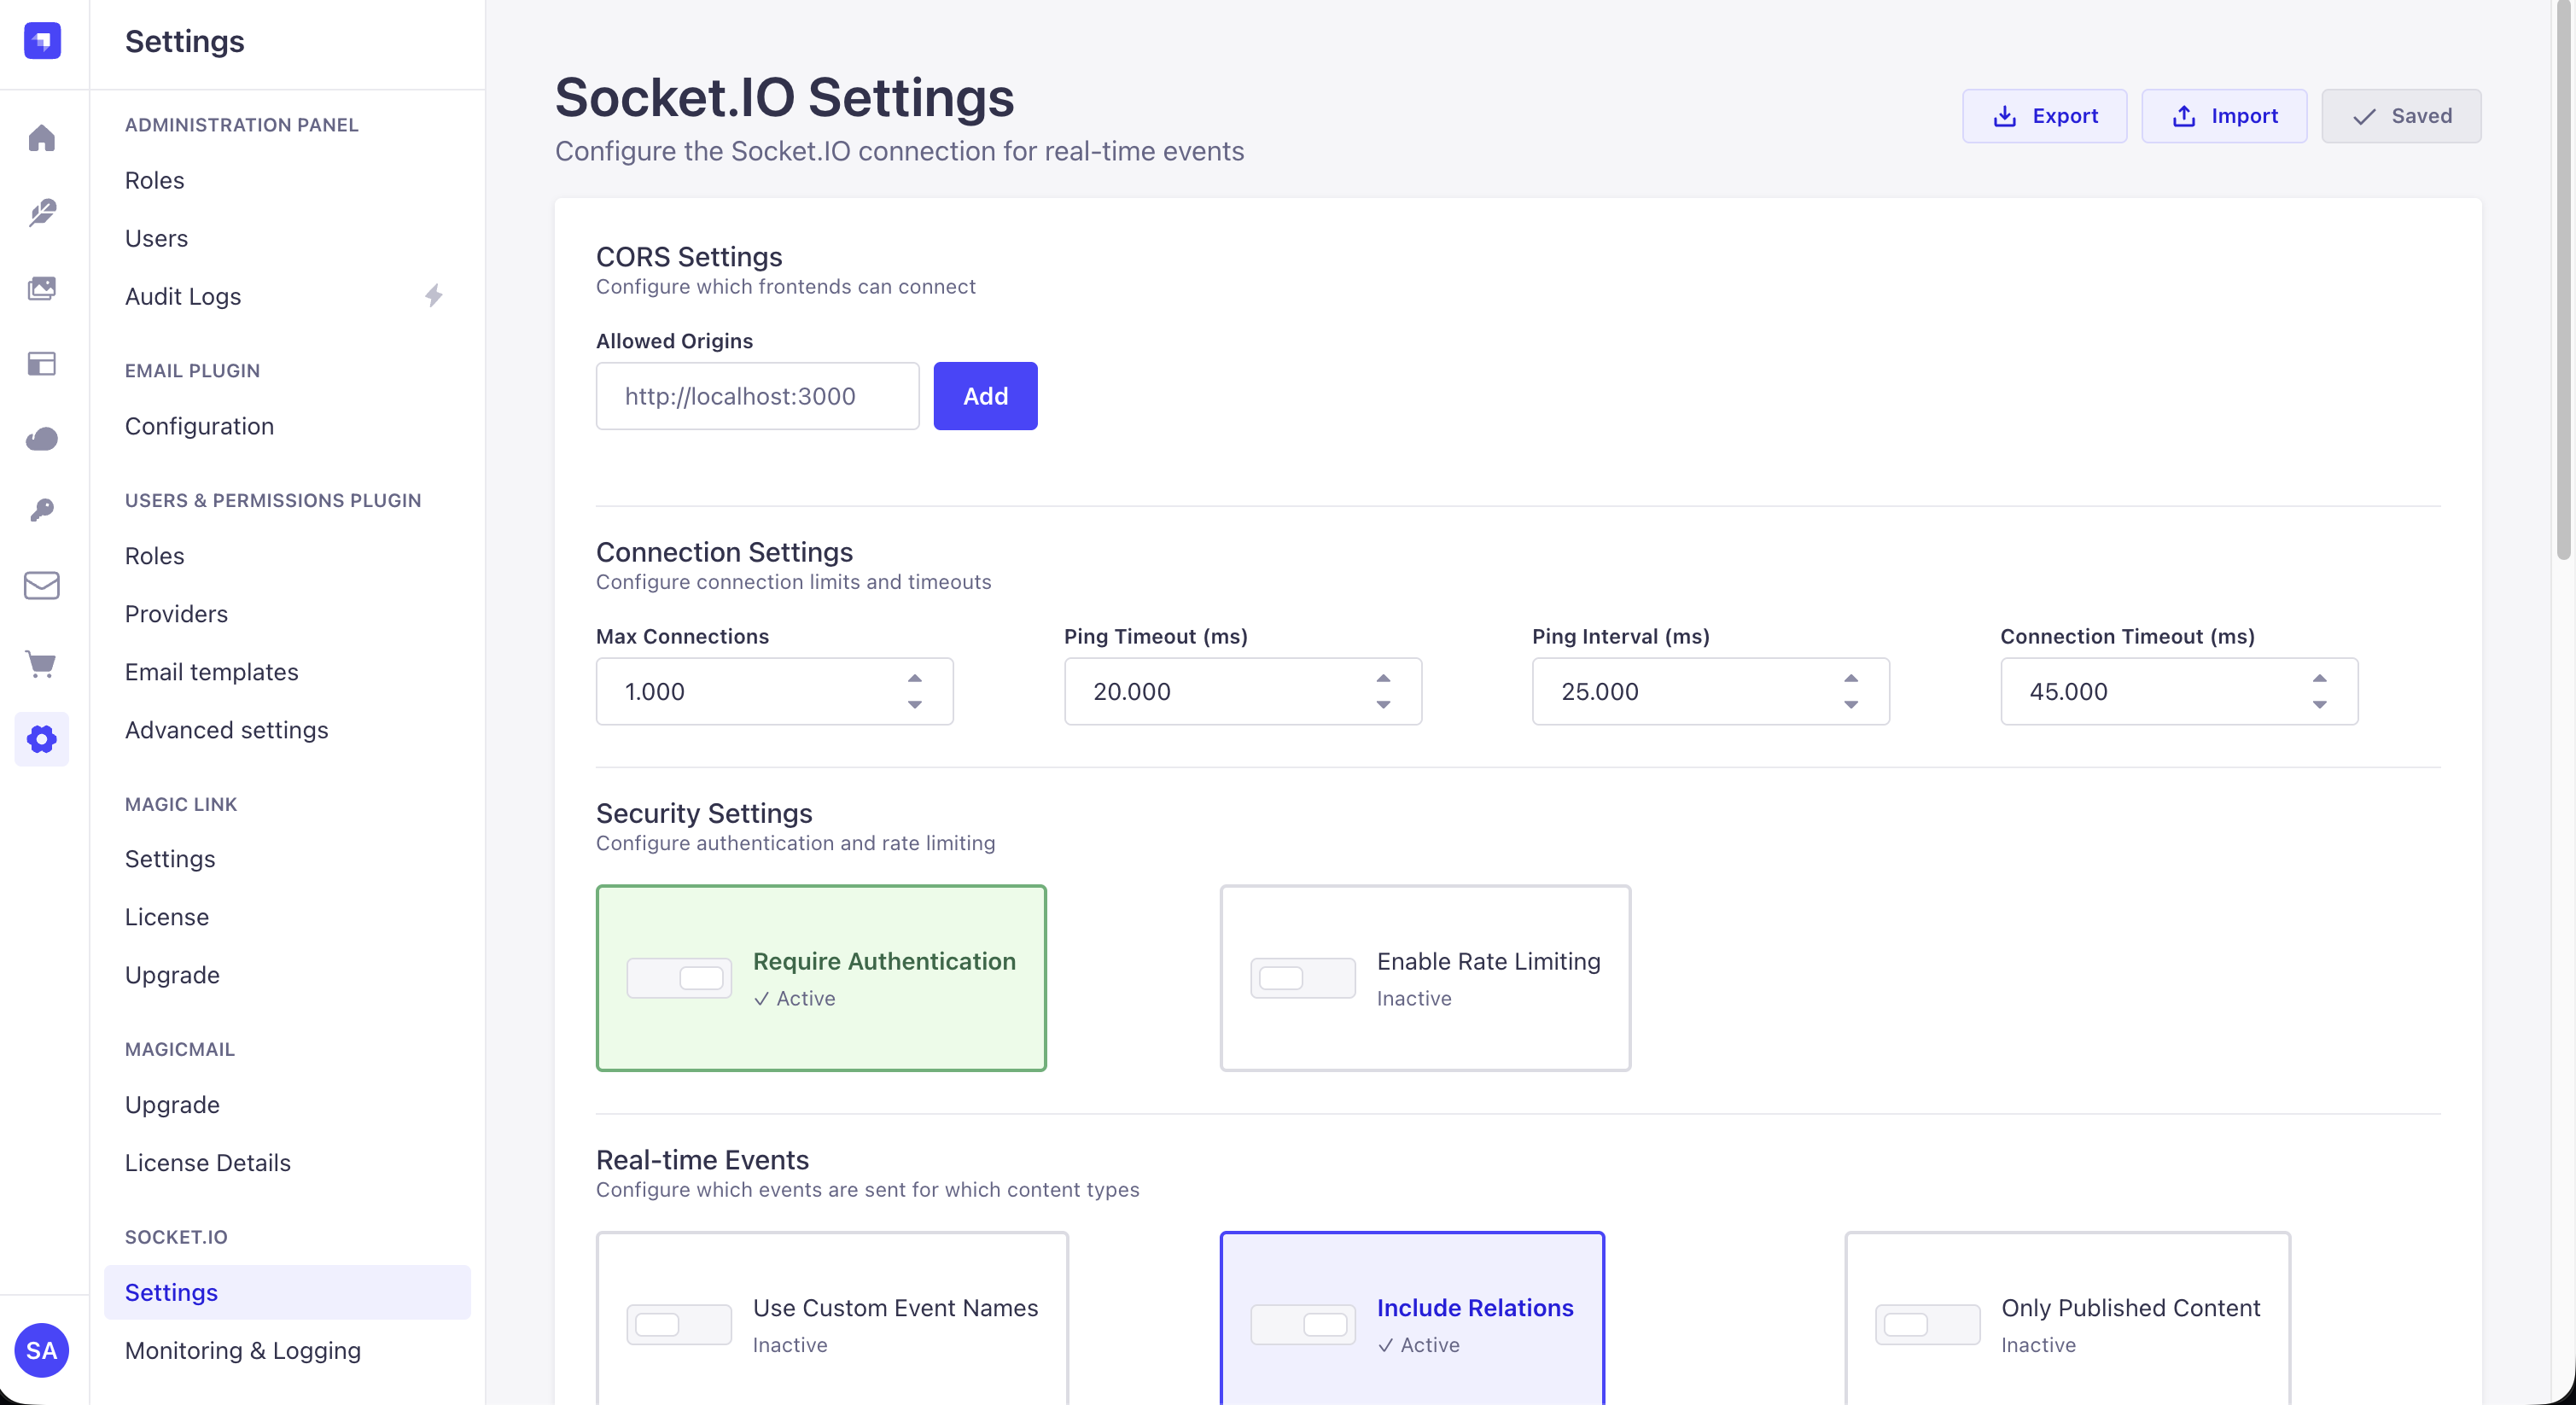
Access full settings by clicking the "View Settings" link in the widget or navigating to Settings → Socket.IO
Color-Coded Metrics
- Blue Cards - Connection metrics
- Green Cards - Activity metrics
- Orange Cards - Performance metrics
Responsive Layout
- Desktop: Full-width cards with icons
- Tablet: 2-column grid
- Mobile: Single column stack
Monitoring Dashboard
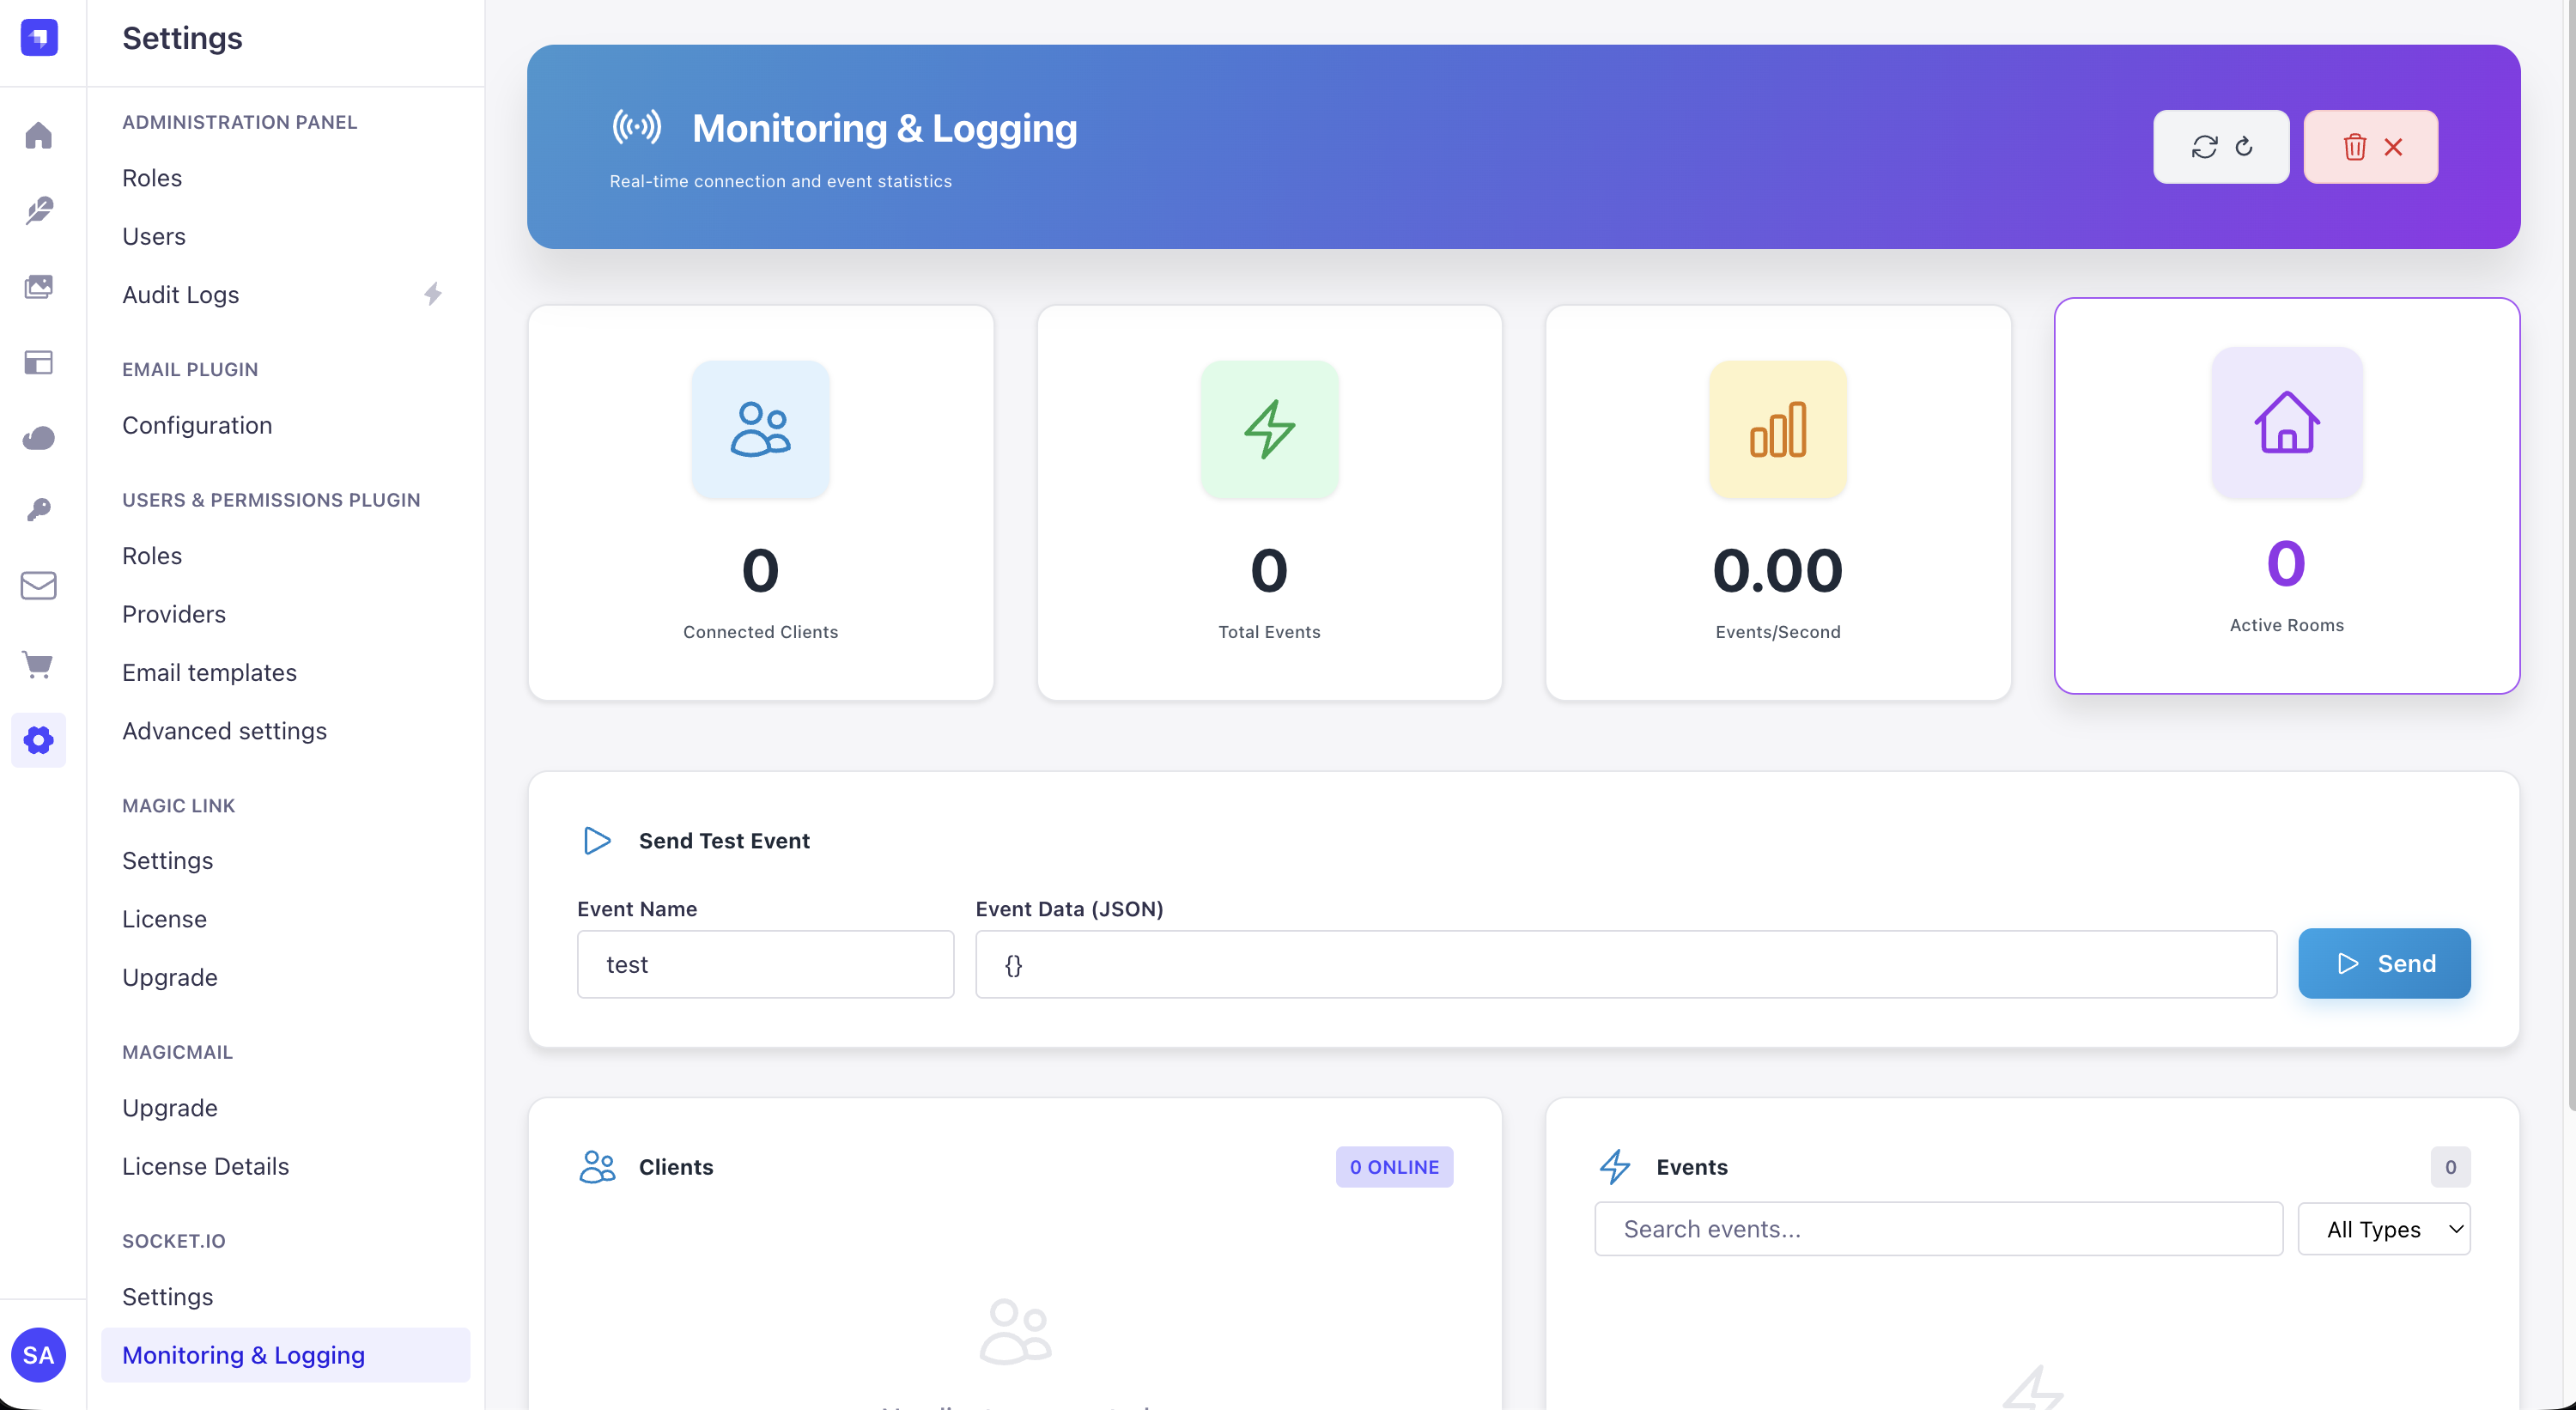
The monitoring dashboard provides detailed insights into connections, events, and performance.
What You Can Monitor
- Active Connections - See who's connected right now
- Connection History - Track connection patterns
- Event Logs - View all emitted events
- User Details - See authenticated user info
- IP Addresses - Monitor connection sources
- Performance Metrics - Events/sec, total events
Customization
Widget Width
Adjust the widget width in your admin configuration:
// admin/src/index.js
app.addWidget({
  id: 'io-stats-widget',
  Component: SocketStatsWidget,
  width: 8, // Change: 1-12 (12 = full width)
});Refresh Interval
Change the auto-refresh interval:
// Change from 5000ms (5 seconds) to desired interval
const interval = setInterval(fetchStats, 5000);Benefits
For Developers
- 👀 Visual Monitoring - See Socket.IO activity at a glance
- 🐛 Debug Tool - Quickly spot connection issues
- 📊 Performance Tracking - Monitor event rates
For Admins
- 📈 Real-Time Insights - Live connection data
- 🚨 Issue Detection - Notice problems immediately
- ✅ System Health - Confirm Socket.IO is running
For Teams
- 👥 Collaboration - See team activity
- 📊 Metrics Dashboard - Shared visibility
- 🎯 Decision Making - Data-driven insights
Troubleshooting
Widget Not Showing
Check plugin is enabled:
// config/plugins.js
module.exports = {
  io: { enabled: true }
};Restart Strapi:
npm run developStats Not Updating
Check browser console for errors
Verify API endpoint:
GET /io/monitoring/statsClear cache and refresh:
rm -rf .cache build
npm run developWidget Shows Zero Connections
This is normal if:
- No clients are currently connected
- Plugin just started
- All sockets disconnected
Test connection:
import { io } from 'socket.io-client';
const socket = io('http://localhost:1337');
// Check widget - should show 1 connectionSee Also
- Getting Started - Install and configure
- Monitoring Service - API for monitoring
- Configuration - Admin panel settings
Widget Version: 3.0.0
Compatible with: Strapi v5.x
Auto-Refresh: Every 5 seconds
Location: Admin Dashboard Home Page